Pulse Web Analytics

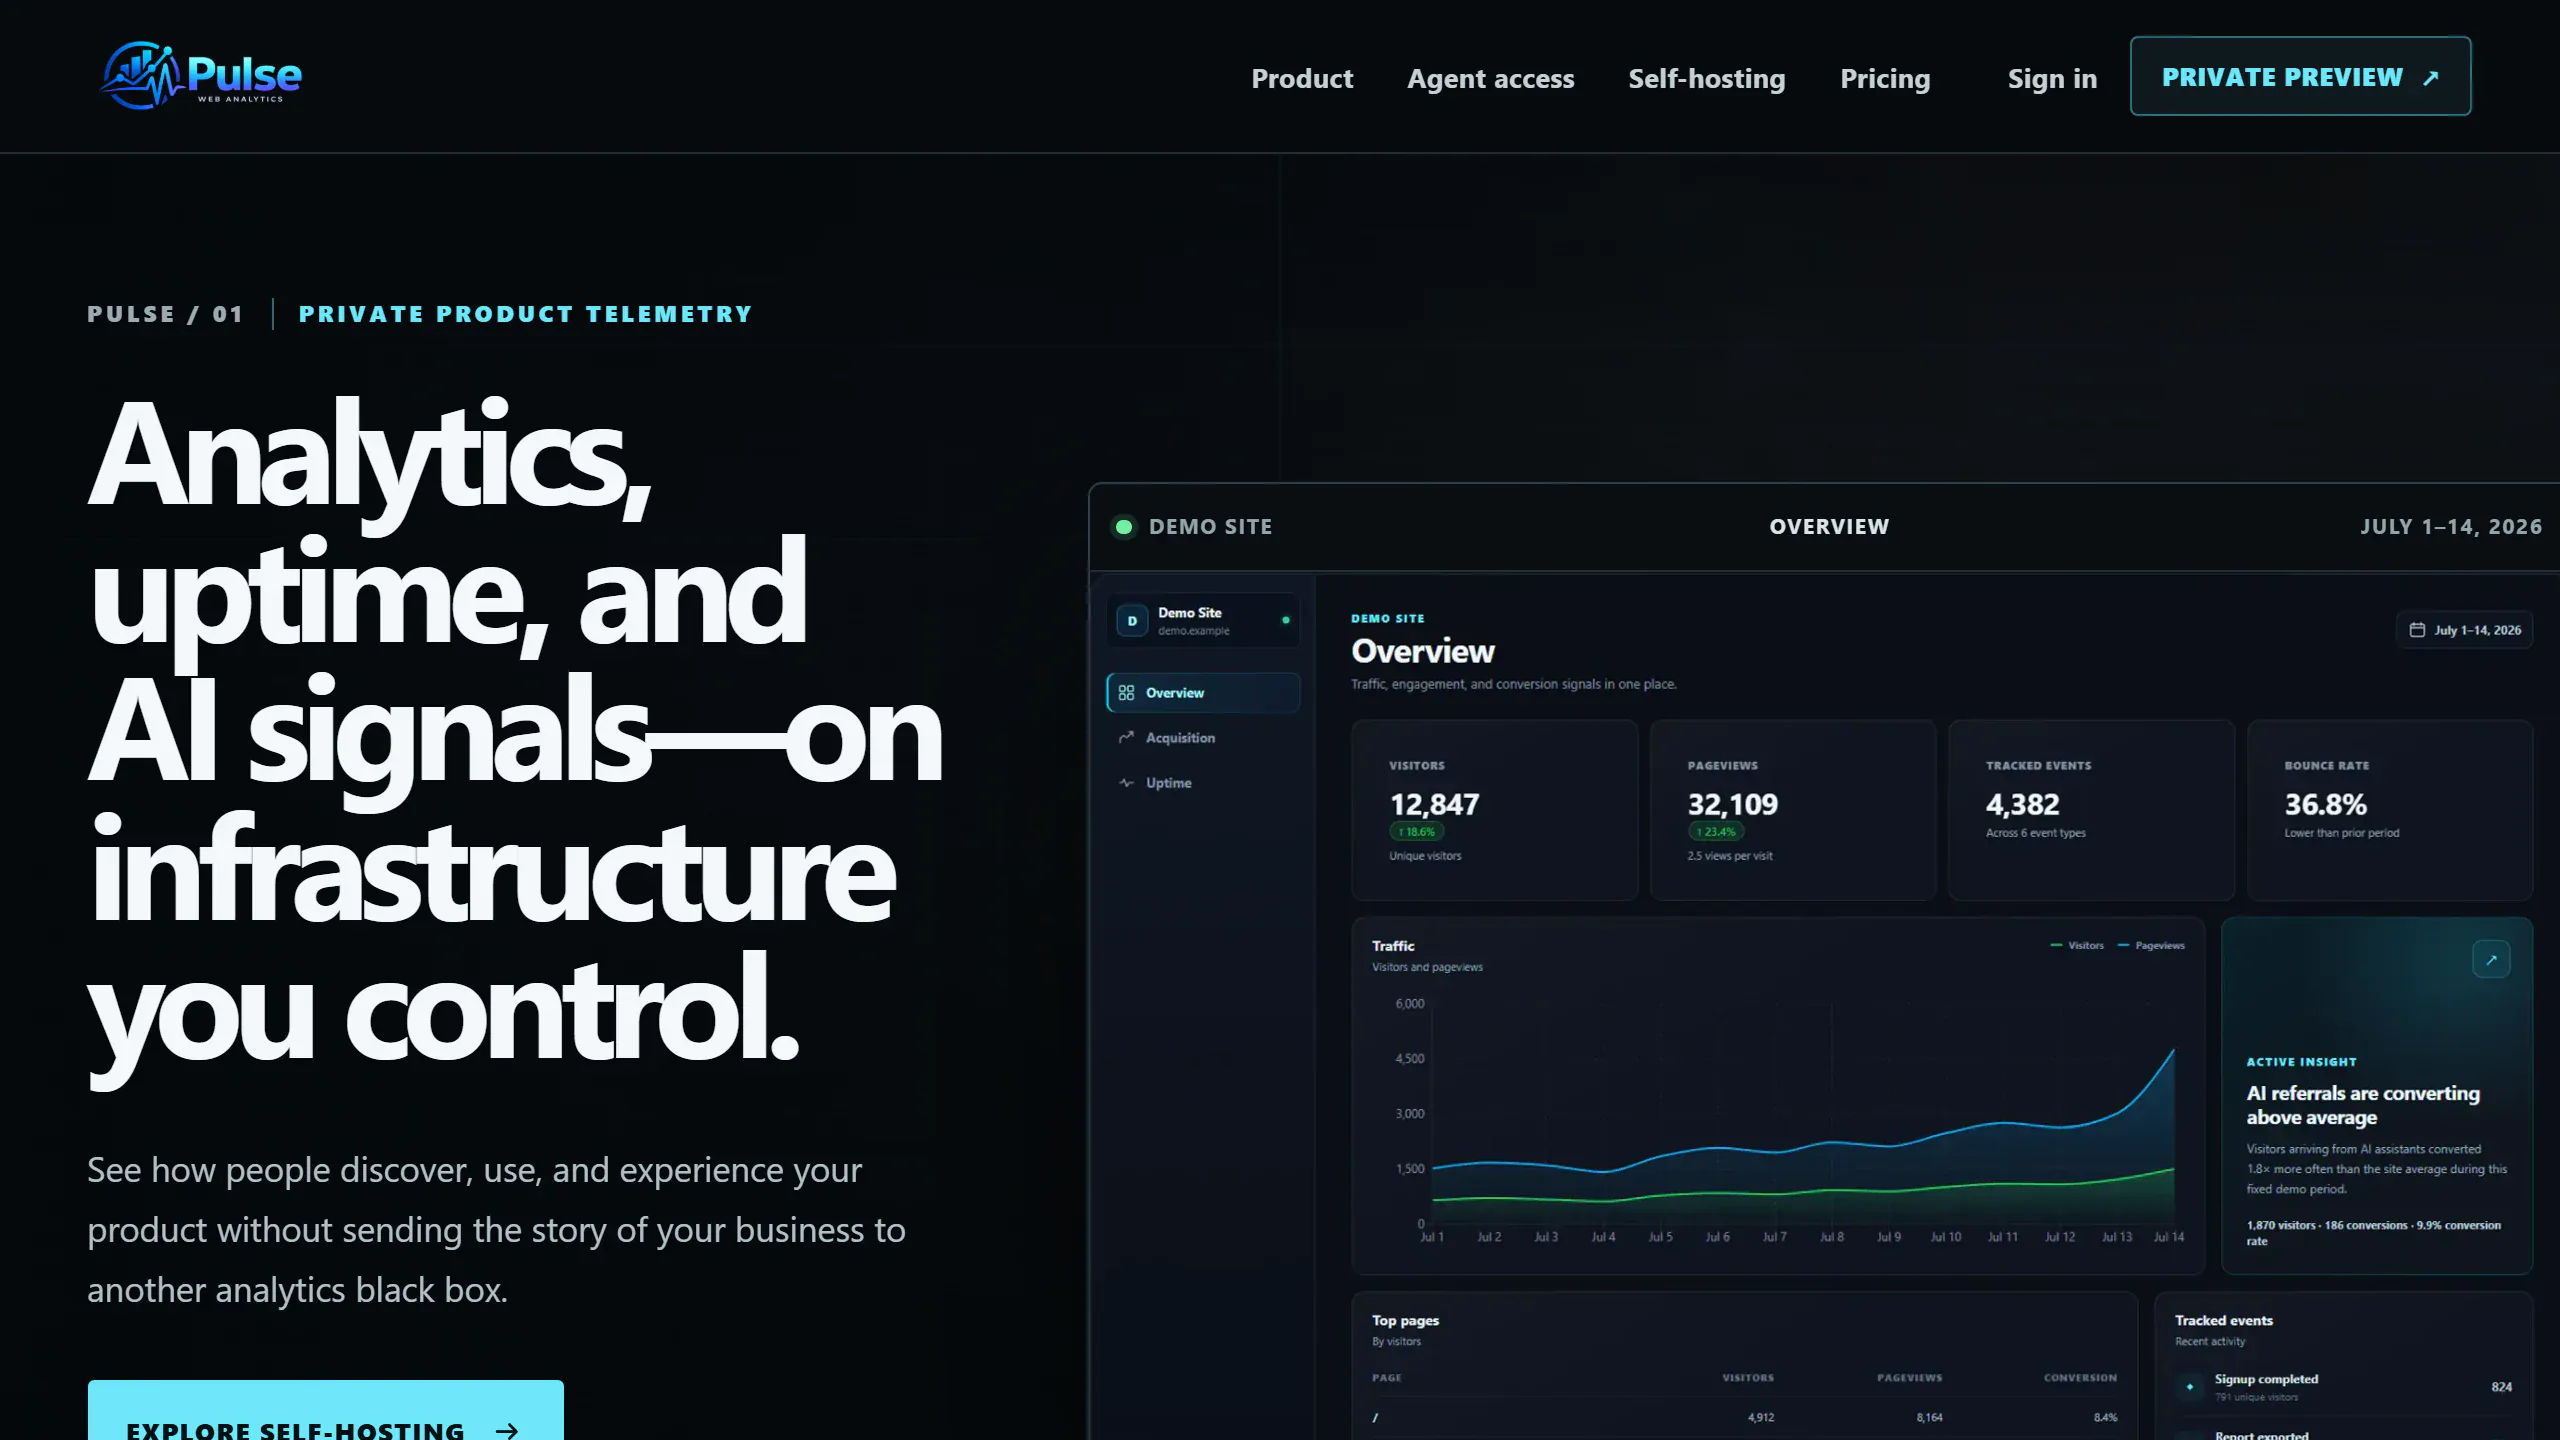
A private preview of web analytics, uptime monitoring and AI-referral reports. Public registration is closed; self-hosted distribution is being prepared.

Pulse private-preview homepage with a clearly labelled demonstration analytics dashboard.

Interface captured . The live site may have changed since.

Role
Product design, analytics engineering, and self-hosted infrastructure
Delivery
Self-hosted VPS + Docker
Availability
Preview / private access
Signals
Analytics + acquisition + uptime

How it works

The system, drawn end to end.

PRIVATE DATA PLANEWeb eventsAcquisitionUptimePostgreSQLReportsone operating pictureREST + MCPsite-scoped accessPULSE / CONNECTED SIGNALS

Swipe to see the whole system

  1. Connect the signals

    Traffic trends, referral quality, and reliability belong in the same product investigation.

  2. Keep the data plane understandable

    The deployment model uses Docker and PostgreSQL on infrastructure the operator controls.

  3. Scope agent access

    REST and MCP reporting are designed around site-level scopes and an audit trail of report requests.

The problem

The operating problem behind the interface.

Traffic, acquisition, and availability are often investigated in separate tools. Product teams need enough shared context to understand whether a change comes from how people arrive, what they do, or whether the service is healthy.
The approach

A product model designed around the decision.

Pulse connects web analytics, acquisition, and uptime in one operational view. Its private preview also describes site-scoped reporting for agents, with a Docker and PostgreSQL self-hosted release being prepared.

Engineering scope

The system behind the surface.

  1. Next.js, React, and TypeScript reporting interfaces
  2. PostgreSQL-backed analytics and operational data
  3. Site-scoped REST and MCP reporting with Docker-based deployment design